


The number of new homes added to the housing inventory increased in 2023, but the declining number of homes under construction and permits could be a sign of future challenges.

If completed units reveal the more immediate state of the housing market, housing starts and permitting activity are the canary in the coalmine: Fewer homes under construction and falling permits mean dwindling options for future buyers, adding more pressure to a market already strained by tight supply.
In 2023, housing completions seemed solid: 1.4 million new homes hit the market, a 4.2% increase compared to 2022. The catch? The number of new homes increased only due to the development of the multifamily sector, which jumped 22% year-over-year.
Coupled with the fact that new single family homes are dropping, this could point to a shift towards bolstering the rental sector rather than relieving the pressure on the homes for sale front.
Further proof that the future could be rocky for homebuyers, the number of homes under construction fell by 9%, while the total number of permits dropped by 11% year-over-year.
Here are some more highlights from our yearly Housing Construction Report (click here to access the page with the full data set):
- The total number of completed homes rose last year due to the 22% increase in multifamily units, which compensated for the 2% decrease in new single family homes.
- In 2023, permits fell for the second year in a row: Last year’s 11% drop followed the 5% drop from 2021.
- Like permits, total started units fell in 2023, by 9%. Similar to the negative trend in permitting activity, 2023 was the second year when builders broke ground on fewer homes compared to the previous year.
- Of the 384 total U.S. metros, permits fell in 266 and increased or stagnated in 118. This means that a distressing 70% of all U.S. metros saw a reduction in new permits in 2023.
Why Is This Happening?
Theoretically, new construction should be bolstered by the acute shortage of housing on the market. However, with supply chain issues piling up and loan rates for builders continuing to rise, developers’ confidence is going in the opposite direction.
And, as both builders and home sellers become more cautious and keep to the sidelines to try to insulate themselves from the negative effects of rising rates and financial uncertainty, their withdrawal might negatively affect supply and affordability in the near future.
That said, the new year seems to bring a welcome change: Despite the factors pushing back on housing construction and permitting activity, mortgage rates falling below 7% might signal a positive shift. According to the National Association of Home Builders’ January press release, builder confidence is on the mend:
“Mortgage rates well under 7% over the past month have led to a sharp increase in builder confidence to begin the new year. Builder confidence in the market for newly built single-family homes climbed seven points to 44 in January, according to the National Association of Home Builders (NAHB)/Wells Fargo Housing Market Index (HMI) released today.
This second consecutive monthly increase in builder confidence closely tracks with a period of falling interest rates.”
Permits Drop for Second Year in a Row: Only 1.4 Million New Homes Approved in 2023
Completed homes rise moderately, but starts and permits fall
The number of new homes that hit the market in 2023 rose 4.2% year-over-year, reaching 1,450,000 units. This smaller rise is in line with the more subdued increases in the last five years.
While the pandemic is almost forgotten, that need for space created a powerful momentum that lasted well into 2023. As a result, builders are still mindful of homebuyers’ demand for more space following the reassessment of their housing needs: Although their numbers dropped, one million new homes were single family homes, whereas 450,000 new units were developed as part of two-unit or multifamily buildings.
Likewise, construction started on a total of 1,420,000 new homes, with the majority of them (947,000) being single family homes. However, this represented a 9% decrease compared to 2022 numbers, with both single family and multifamily starts on a downward trend.
Add in the fact that 2023 was the second year in a row when new residential construction fell and it becomes obvious that home builders are increasingly affected by rising loan rates and high construction costs, an issue that could send unfortunate ripples through the housing market in the not so distant future.
Going further, falling permits hint at even more housing challenges down the line, affecting both builders and future renters and buyers. Fewer permits in 2023 means fewer new homes in the following years, adding insult to injury in a housing market that's already suffering from low inventory and completely unaffordable prices.
Permits Drop in 70% of U.S. Metros, with Only a Handful Seeing Significant Increases
Despite drop, Texas remains undefeated: Dallas & Houston approved more units than the bottom 237 metros combined
- Regional Level: The South leads with the most permits issued (821,600), followed by the West (344,500), the Midwest (190,200) and the Northeast (114,300).
- State Level: Despite year-over-year drops in numbers of permits, the top three states hoping to build the most in the near future are Texas, Florida and California, all of which boast numbers of permits higher than 100,000 and even more than 200,000.
- On the other hand, in 18 states, less than 10,000 permits were issued per state, with Alaska authorizing less than 1,000 new homes.
- Metro Level: The three metros that had the highest numbers of permits issued in 2023 were Houston-The Woodlands-Sugar Land, TX; Dallas-Fort Worth-Arlington, TX; and Phoenix-Mesa-Chandler, AZ.
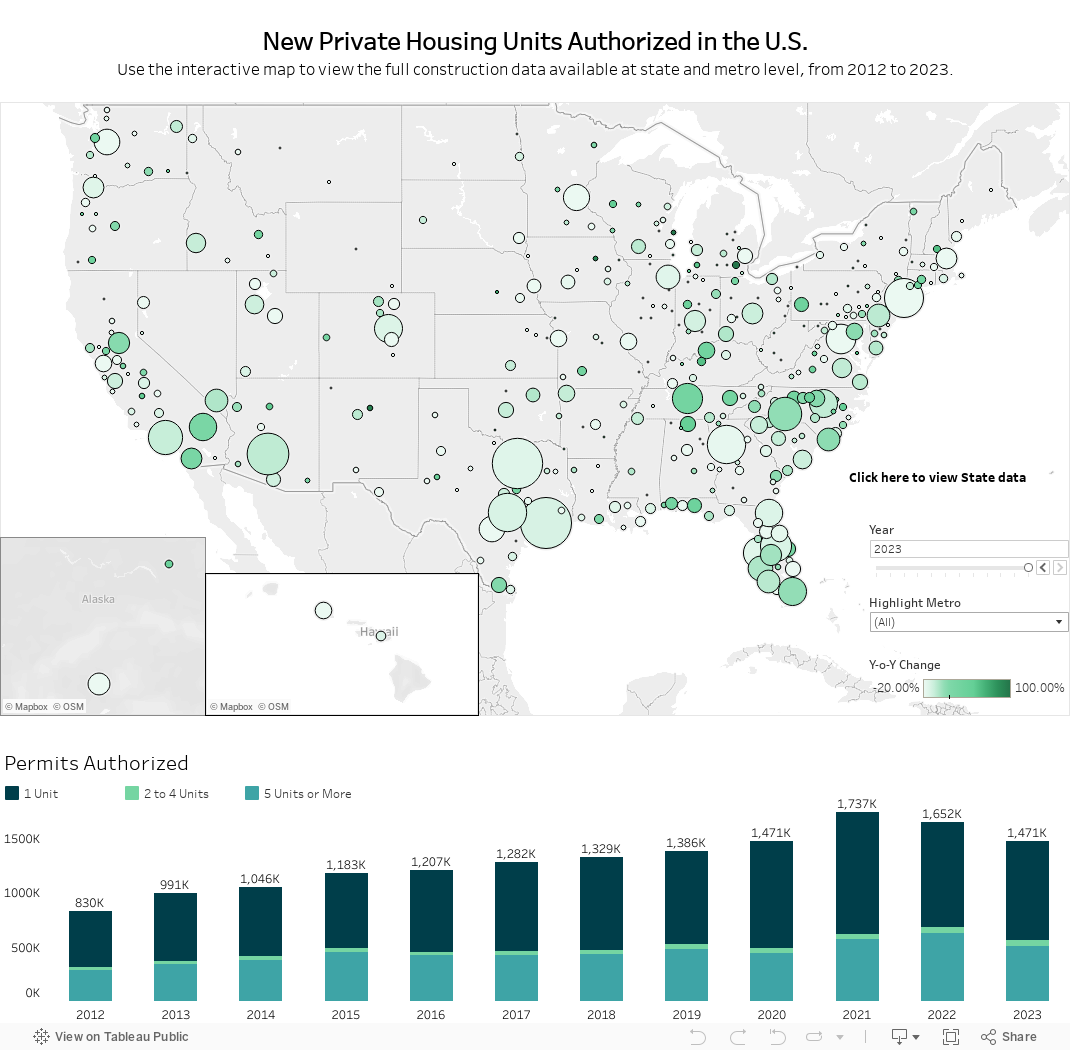
Looking at the metros with the most significant year-over-year changes in number of permits, it was the smaller ones that led the way. Granted, that's to be expected: In small cities and metros, even one or two multifamily buildings being authorized or not has a considerable impact on the total number of permits and inventory.
However, it's the large metros, with thousands of homes and permits where big fluctuations might point to changing trends.
Large Metros: Falling Permits Might Maintain Pressure for Years to Come
Of the 56 large U.S. metros, permits increased in only 10. Of those, only seven metros saw more significant jumps (between 10% and 35%) in the number of authorized new homes. In the remaining 46 large metros, permitting activity went down or, at best, stagnated.
For instance, in Rochester, NY; Seattle-Tacoma-Bellevue, WA; Kansas City, MO-KS; San Francisco-Oakland-Berkeley, CA; New York-Newark-Jersey City, NY-NJ-PA; and San Antonio-New Braunfels, TX, permits for new homes dropped more than 30% year-over-year.
And, when there are more homebuyers than homes, prices go up. This means that expensive markets like Seattle, San Francisco and New York will put even more pressure on buyers' pockets. So, home seekers living in one of these big, in demand urban hubs who are hoping to find a home within budget might want to readjust their expectations.
Other low-ranking areas included Buffalo-Cheektowaga, NY; Urban Honolulu, HI; Hartford-East Hartford-Middletown, CT; Providence-Warwick, RI-MA, where the number of new permits is almost insignificant, all issuing less than 2,000 permits for new housing units.
How these low numbers of new permits will affect local markets remains to be seen. Of course, shrinking inventory is almost never a good sign for home prices and, consequently, would-be homebuyers. However, other market factors (like a decreasing mortgage rate) might persuade buyers that becoming a homeowner is still worthwhile.
Methodology
- For this study, we worked with historical data from the U.S. Census Bureau and the U.S. Bureau of Labor Statistics.
- We analyzed yearly data points, beginning with 2013 and ending with 2023, the year with the most recent available data.
- We looked at the number and value of permits issued by housing type, the number of completed and started units, and the average and median square footage of started and completed units, as defined by the U.S. Census Bureau and the U.S. Bureau of Labor Statistics.
- We extracted data at the national, regional, state and metro levels, and included all 384 existing U.S. metros.
- We divided the metros into three categories, based on their population:
- Large metros are metros with a population higher than 1,000,000 residents.
- Medium metros are metros with a population between 500,000 and 999,999 residents.
- Small metros are metros with a population less than 500,000 residents.
-------------------------------
SOURCE: Point2Homes.com
Andra Hopulele is a Senior Real Estate Writer at Point2. With over seven years of experience in the field and a passion for all things real estate, Andra covers the impact of housing issues on our everyday lives. She writes about the financial implications of the new generations entering the housing market and about the challenges of homeownership. Her studies and articles have appeared in publications like REM Online, Yahoo Finance, Which Mortgage, and Le Quotidien. Andra can be reached at


